By Nicola Pring and Chen Wu
New York Police Department commissioner Ray Kelly will turn his office over to incoming commissioner Bill Bratton on Jan. 1, and although Kelly’s 12-year legacy includes a great reduction in crime citywide, violence rages on in some city neighborhoods. In Part One of this special report on homicides, The Brooklyn Ink examines the trends in Brooklyn over the past decade, and takes a numerical snapshot of the borough’s most recent killings.
MURDER AND TOTAL CRIME
According to the crime statistics released by the NYPD from 2000 till now, the number of what the NYPD classifies as the seven major felony offenses—murder and non-negligent manslaughter (defined as the willful killing of one person by another), rape, robbery, felony assault, burglary, grand larceny and grand larceny of A motor vehicle—has steadily declined in Brooklyn in the first 10 years after 2000, dropping by some 2,000 crimes annually on average from 2001 to 2009. Brooklyn crime rebounded during 2010 to 2012—as it has through the whole city. In fact, crime was on the rise in 2011 and 2012 for the first time in 20 years—and then dropped again, by around 4,000, this year.
Meanwhile, murder in Brooklyn stayed fairly stable from 2000 to 2010, and dropped sharply in the next three years. But not everywhere, or for everyone, as the next four charts show.
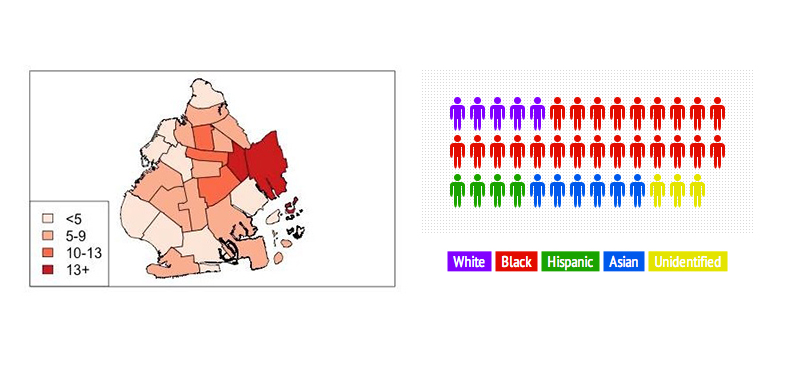
According to the NYPD, there were 41 homicides in Brooklyn between Aug. 1, 2013 and mid-December. Aside from several anomalies, (including a multiple homicide in Sunset Park in late October in which 25-year-old Chen Mingdong was charged with murdering his cousin’s wife and her four children, and an incident in which an Iranian musician shot and killed two members of his band and a third musician) the majority of victims (56 percent) are identified as black, and 63 percent of victims were between the ages of 20 and 40.

Meanwhile, considering all the homicides in Brooklyn so far in 2013, nearly half of them occurred in five NYPD precincts. The above map illustrates which precincts experienced the most killings.
THE PRECINCTS
The 67th precinct in Central Brooklyn had 11; the 73rd in Ocean Hill and Brownsville had 13; and the 75th, which patrols East New York, Cypress Hills, Starrett City, and City Line had 17. The 77th precinct, covering Crown Heights and parts of Prospect Heights and Weeksville, and the 79th precinct, covering Bedford Stuyvesant, each saw 12 homicides. Precincts 67, 75, and 77 have all witnessed a decline in murders over the past 13 years. Precinct 73 has experienced a slight increased since 2000, and murder in precinct 79 has fluctuated, but the number of murders thus far this year matches the number in 2000.
Taken together, these five precinct areas experienced 49 percent of Brooklyn’s 137 homicides this year. Brooklyn’s homicides represent 45.2 percent of the city’s 303 to date.


Leave a Reply